Break Even Point Analysis is based on the cost volume profit relationship in a business.
What Is Profit?
Profit is the difference between sales revenue and the total costs incurred in the business.
If sales revenue is greater than costs, the business makes a profit.
If sales revenue is less than costs, the business makes a loss.
The point where sales revenue equals costs is known as the Break Even Point.
That’s all fairly straightforward and obvious but you may have missed an important point.
Although the objective of a business is to make a profit, you can’t act on profit directly.
Instead your actions will influence revenue and costs and depending on how they change, your profit will change.
That’s why it’s important that you understand how your costs change or don’t change for different levels of sales volume.
The Cost Volume Profit Relationship
There are three fundamental relationships:
- Revenue varies directly with the number of units sold and the price the sales units are sold at.
- Some costs vary directly with the number of units sold and/or produced. As volume increases, these costs increase. These are called variable costs.
- Some costs in the business are fixed for a period and do not vary directly with sales levels. These costs do not automatically increase if sales increase and do not reduce if sales are lower than expected.
An Example Of A Variable Cost
An example of variable cost is the direct purchase cost of what you sell if you own a wholesale or retail business.
If you are a grocery business and you sell cans of baked beans, then when you buy some cans, the cost goes into stock on your Balance Sheet. When you sell a can, it comes out of stock and into your Profit & Loss Account as a cost of goods sold.
If you sell 10 cans, you need to have bought at least 10 cans. If you sell 100 cans, you need to have bought 100. This cost automatically varies with sales volume.
Another variable cost is the third party carriage costs to get the goods from you to your customers.
If you think about buying from Amazon, when you buy, they must pay a carrier to get the goods delivered. They may or may not charge you.
However the relationship isn’t quite as clear cut. As more items are added to the order, the carriage costs may increase or might not depending on the size and weight and their arrangement with carriers.
If you specify an especially quick delivery, their costs increase although they will charge you a premium.
An Example Of Fixed Costs
In contrast, fixed costs do not automatically change when a sale is made or vary based on the size of a sale.
A great example of this is property rent.
The money you pay to rent a property is charged for a particular period – say £2,500 per month.
Whether you sell nothing or you break your sales record, the amount of rent you pay to your landlord doesn’t change.
I should clarify that the phrases “fixed cost” is a simplification.
All fixed costs can change as a result of decisions you make.
If you decide to move properties, your rent will change. If you decide to rent extra space, your rent will increase. If you decide that your business isn’t going to be as big as you first thought and decide to give up space or you can rent it out to someone else, your net rent will decrease.
The Cost Volume Profit Relationship In A Graph
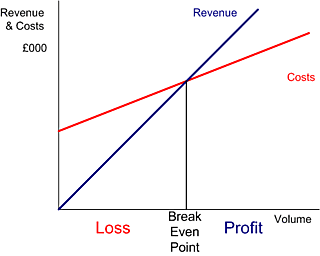
The cost volume profit relationship can be seen by the graph below:

The blue Revenue line starts from zero. If you don’t sell anything, then you don’t generate any revenue.
The red Cost line starts from a point on the £000 axis which represents the fixed costs of the business. These are incurred whether your business sells anything or not.
Where the Revenue line and the cost line meet, the business does not make a profit or loss and is said to be at the break even point.
To the left of the break even point, the business is making a loss because costs are greater than revenue.
To the right of the break even point, the business is making a profit because revenue is greater than costs.
The revenue line is steeper than the cost line because the business is profitable and sells its products for more than they cost. This means that at some volume, the business will reach its break even point.
If the business was paying £100 for its products and selling them for £80, the cost line would have a steeper gradient, the business would never reach the break even point and every extra sale would increase the loss.
An Alternative Way To Look At The Cost Volume Profit Relationship
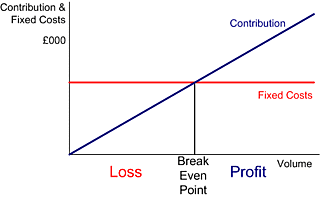
An alternative way to think about your cost volume profit relationship is to see the profit margin on your sales as contributing to meeting and then exceeding your fixed costs.
In this approach you don’t look at total revenue and costs but instead focus on the contribution of every sale. This is the difference between your sales price and the variable cost of that sale.
So for example, a book shop may have an average selling price per book of £10 with an average cost price of £7. This means that the contribution (margin) per book is on average £3.
If it sells 10 books in a day, the contribution is £30. If it sells 100 books, the contribution is £300.
And if fixed costs for the shop (rent and other property costs, staff costs, marketing, administration) are £180, then at some point during the day, the shop passed its break even point and started to make a profit.
This changes the cost volume profit or break even graph to look like the one below:

This is the approach that I prefer since it helps focus on the three basic profit generating tactics available to every business, much more clearly:
- Can you increase your sales volumes?
- Can you increase the contribution per sales unit (either by having a higher selling price or a lower variable cost)?
- Can you reduce your fixed costs?
These three questions are the very essence of working with the break even analysis / cost – volume – profit relationship to improve the results of a business.
This presentation also gives you a big clue on how to calculate your break even point.
How Do You Calculate The Break Even Point From the Cost Volume Profit Relationship?
The standard calculation uses the simplifying logic of the second graph and therefore if you want to calculate the break even point for a business you need to know:
- The value of fixed costs
- The contribution margin either as per unit or as a percentage of sales.
The Break Even Point Formula is simple:
The Break Even Point (in sales volume) = Fixed Costs / Contribution Margin Per Unit
The Break Even Point (in sales value) = Fixed Costs / Contribution Margin % of Sales Value
I will look at this calculation in much more detail in my article
>>> How To Calculate Your Break Even Point.
Get To Know Me
[sos]
[6Steps]


hi Paul, i am a student and i have a big problem to solve an excercise for a CVP analyse.
i hope to find the solution by this way for this exercise for school.
i hope you can find the solution for these problems
this is the problem they asked
Steve Wheatamyer has acquired the Morton Inn, a 100-room limited-service lodging property.
Its costs are as follows:
Variable costs per room sold: $20
Monthly fixed costs: $100,000
Mixed costs:
Low Month High Month
60% Occupancy 80% Occupancy
Repairs $3,000 $3,500
Utilities $4,000 $5,000
(Note: The mixed costs are not part of the variable and fixed costs above.)
Required:
1. Determine the variable cost per room, considering the mixed costs.
2. Determine the monthly fixed costs,considering the mixed costs.
3. What must the ADR be if the Morton Inn breaks even at the end of the 25th day of each
month?
Assume an average paid occupancy of 75 percent.
i hope you can help me further to find this solution
i cannot find it with the principals of CVP analyses
I’m not doing your homework for you.
I will pick up the topic of mixed costs because this is an issue in real life. It happens where there is an element of regular costs that are likely to be incurred with time and an element of variable costs that varies with use/sales/production (in this example occupancy).
You’ve got to revert to algebra to solve it so it’s time to practice your formulas.
f + 0.6v = 3000
f + 0.8v = 3500
therefore 0.2v = 500
100% v = 2500
80% v = 2000 and since total repairs for 80% occupancy is 3500, fixed costs must be 1500.
The question makes this analysis easy. In real life, it’s harder to derive the formulas but the same principle can be used to split mixed costs.
For example, if you have an office with a small factory, the office will use electricity regardless of whether the factory is busy or not so there is an element of fixed cost but the costs will also increase as factory output increases.
Very interesting presentation !
Many thanks